Improving Metropolitan-Scale Transportation Systems
|
NSF CNS-1446640 |

|
|
|
|
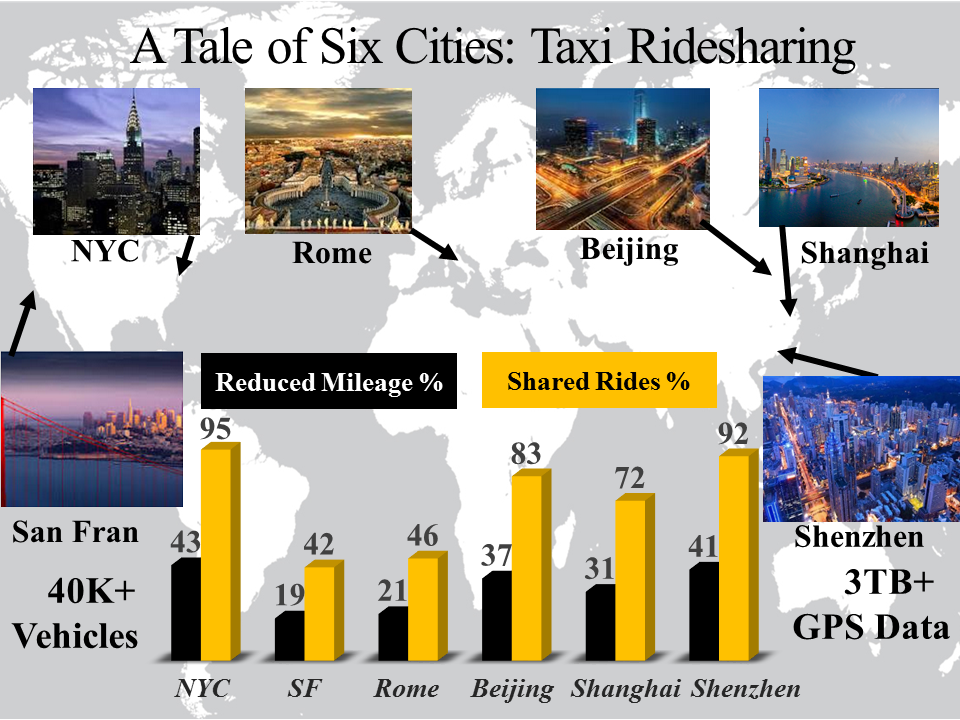
Homogenous SystemsUnder the context of the Internet of Things, everything is connected to everything else in an urban area, enabling a living system producing big data. Bikes and Taxis are examples of data sources in this living system. We have been conducting data-driven research based on bikes systems (the figure above gives station demand) and taxi systems in seven cities on three continents, including New York City, Washington D.C., San Francisco, Roma, Beijing, Shanghai and Shenzhen. For example, the taxi data can be used to infer resident density, urban mobility, traffic congestion and gas consumption in real time at urban scale. Also they can be used to evaluate some new services to quantity their potential benefit. As shown by the figure on the left, we have been working on a project call a tale of 6 cities to evaluate the performance our ridesharing systems in 6 cities around world. On average, we can reduce 30% of mileage and share 70% of taxi rides. The heatmaps of ridesharing traces about these six cities are given as follows. The lighter the areas, the higher the density of shared rides. |

|
|
|
|
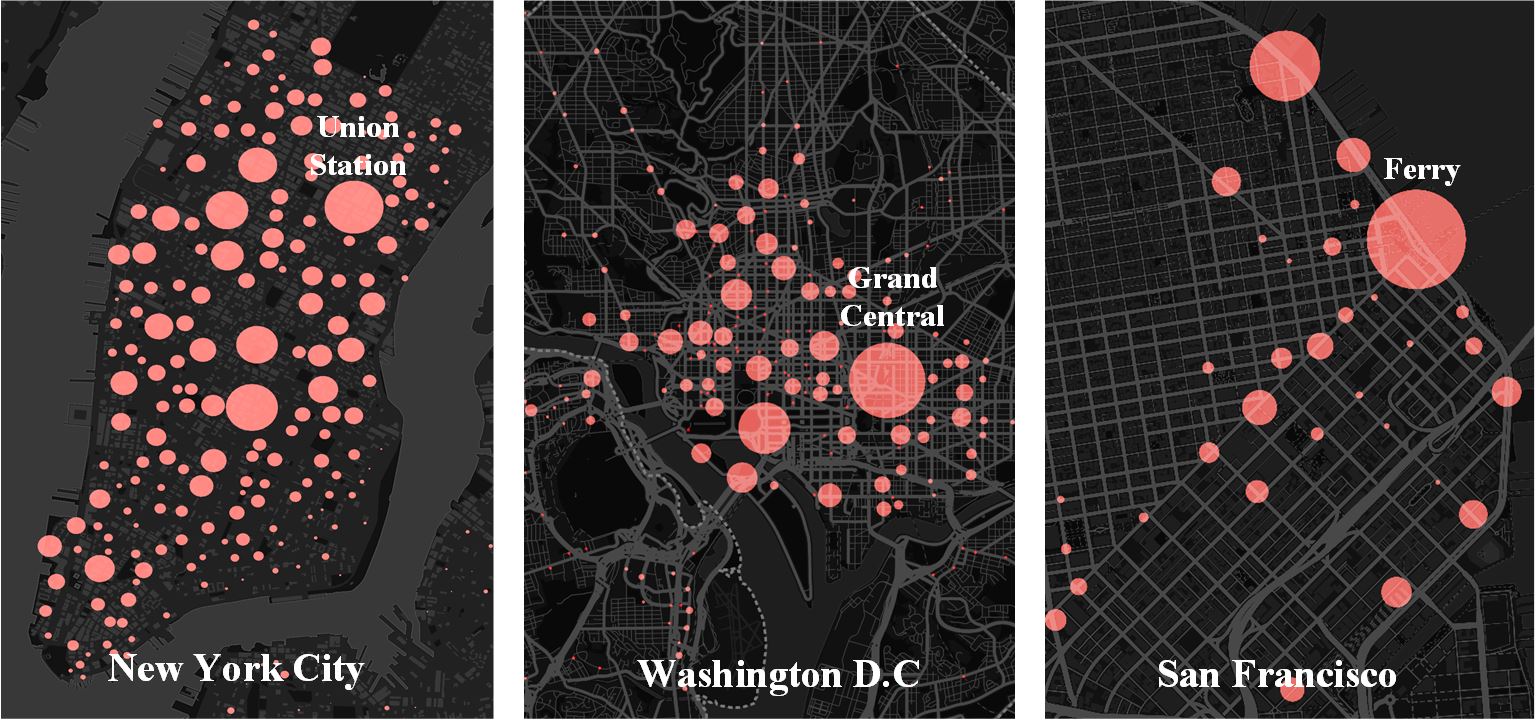
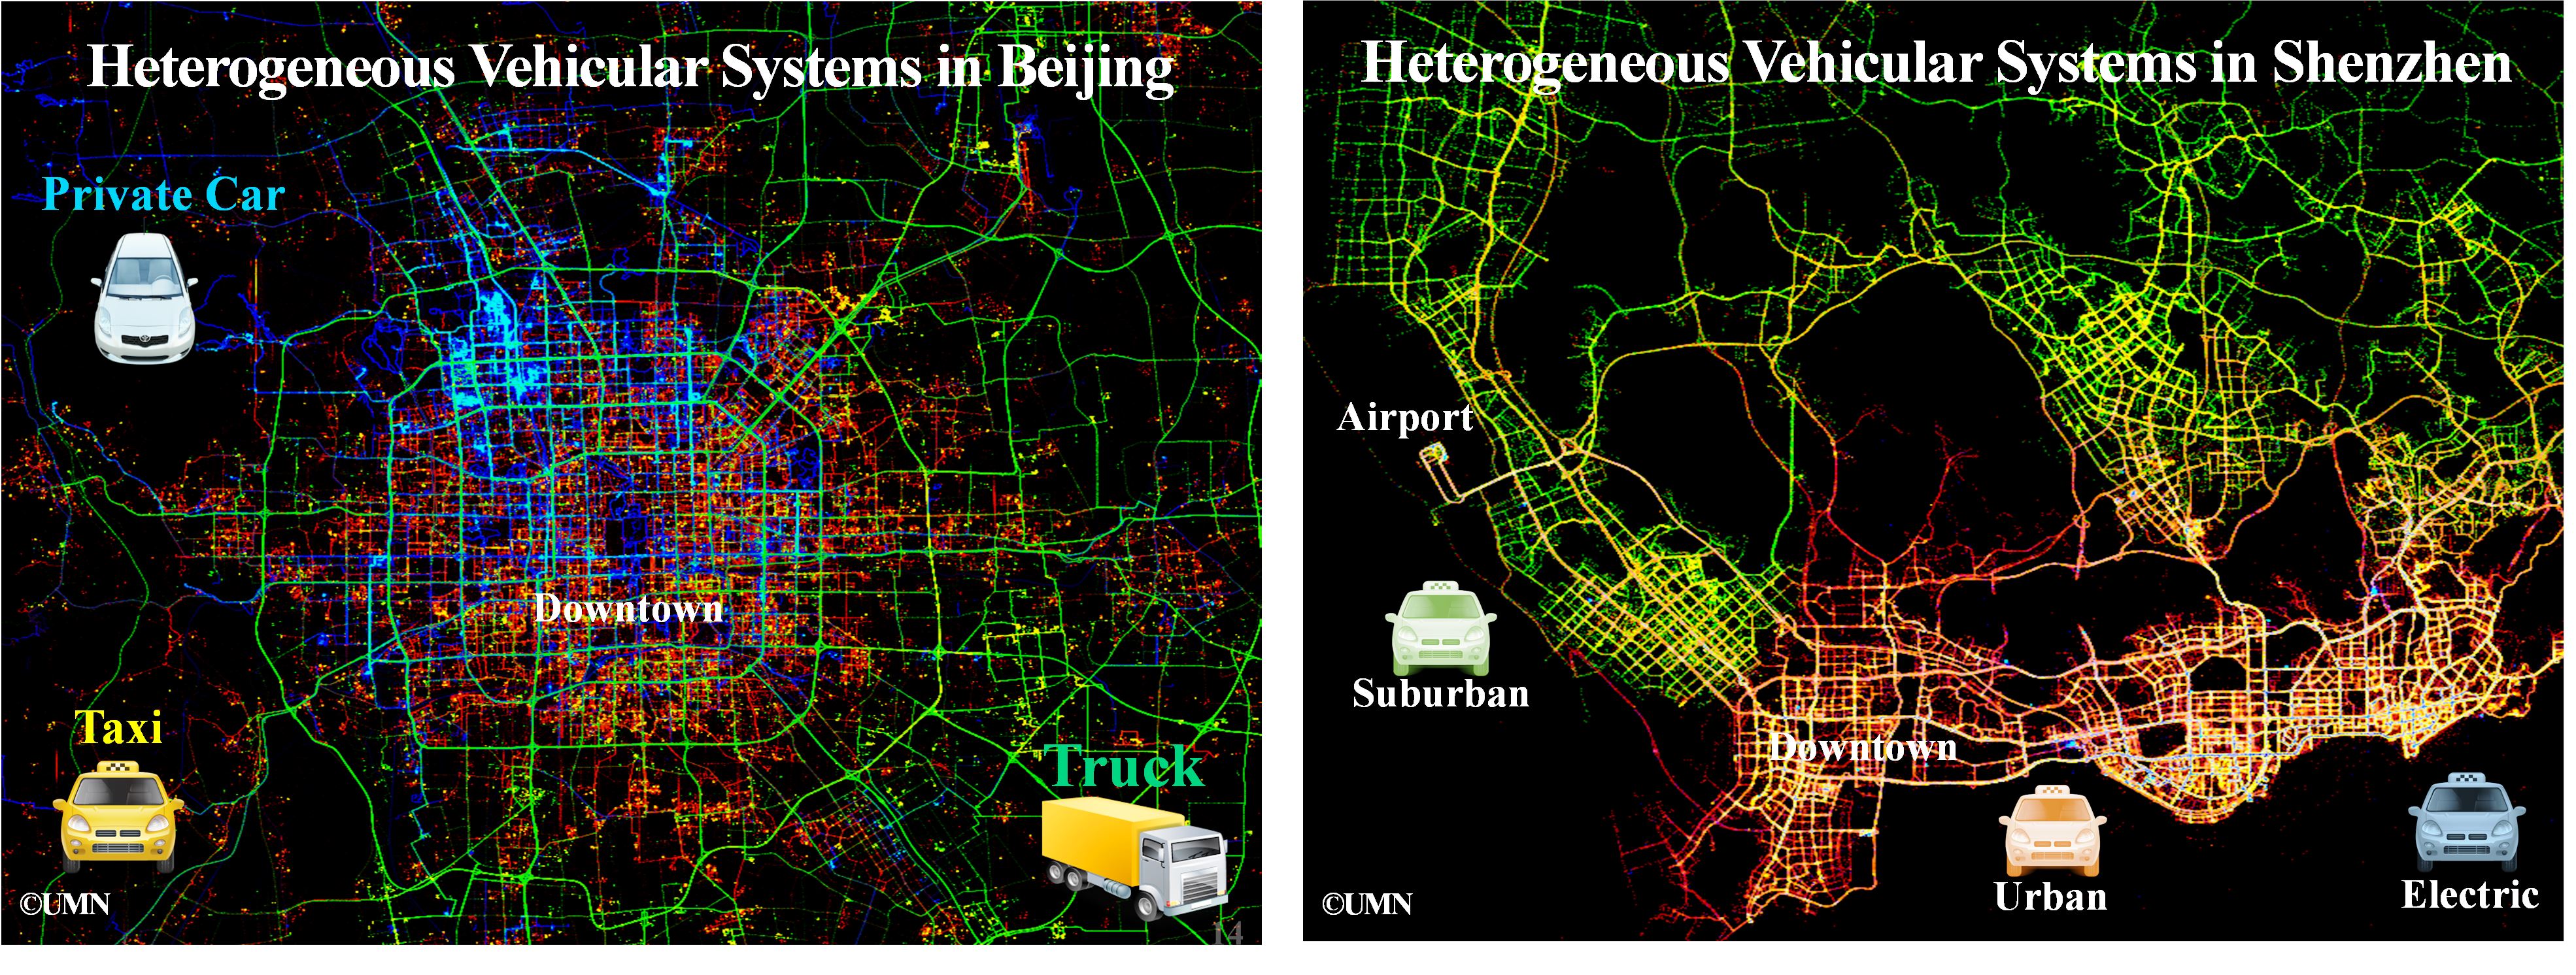
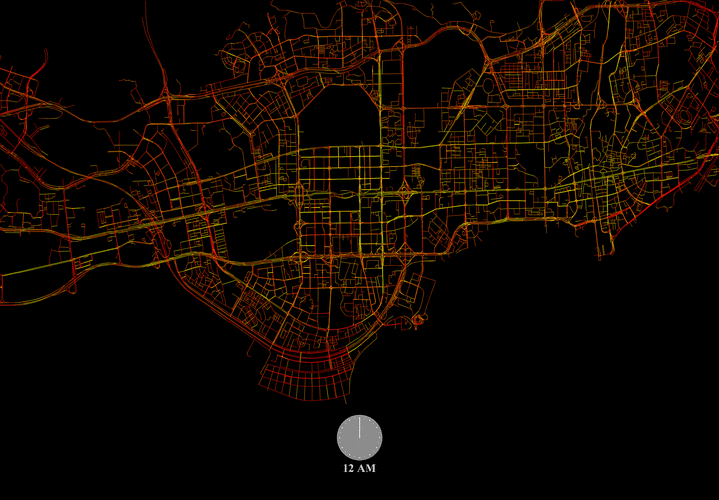
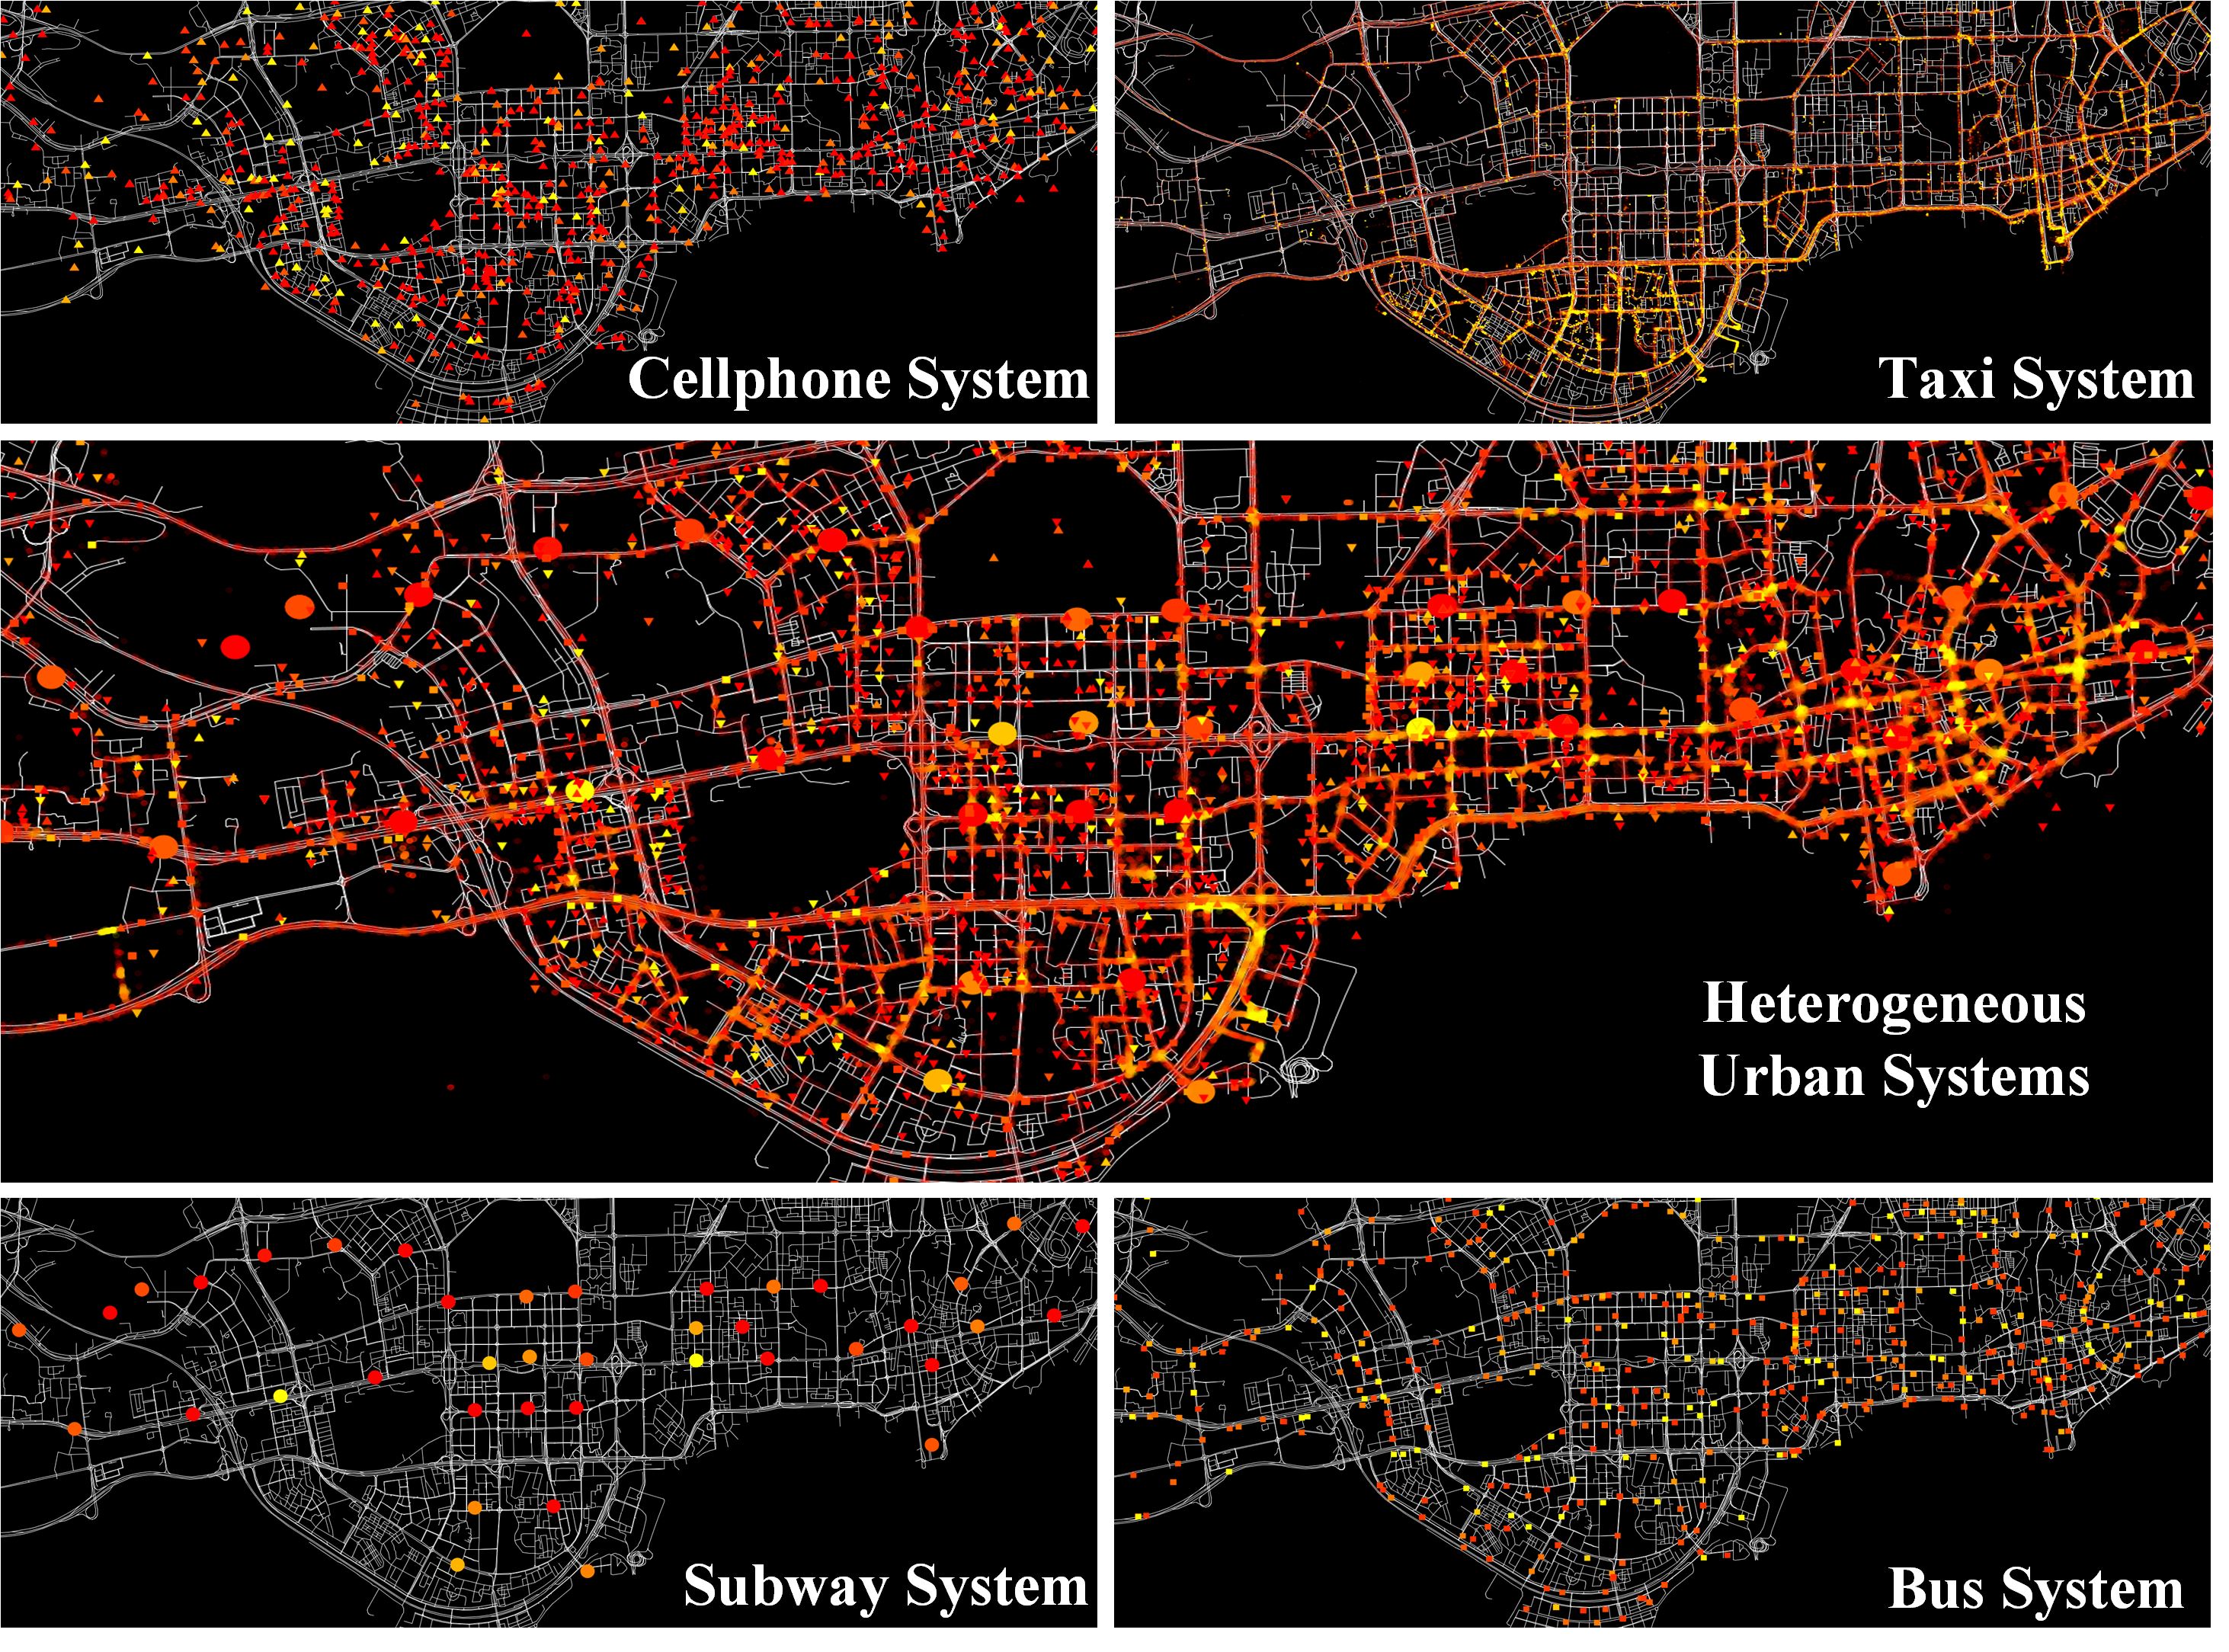
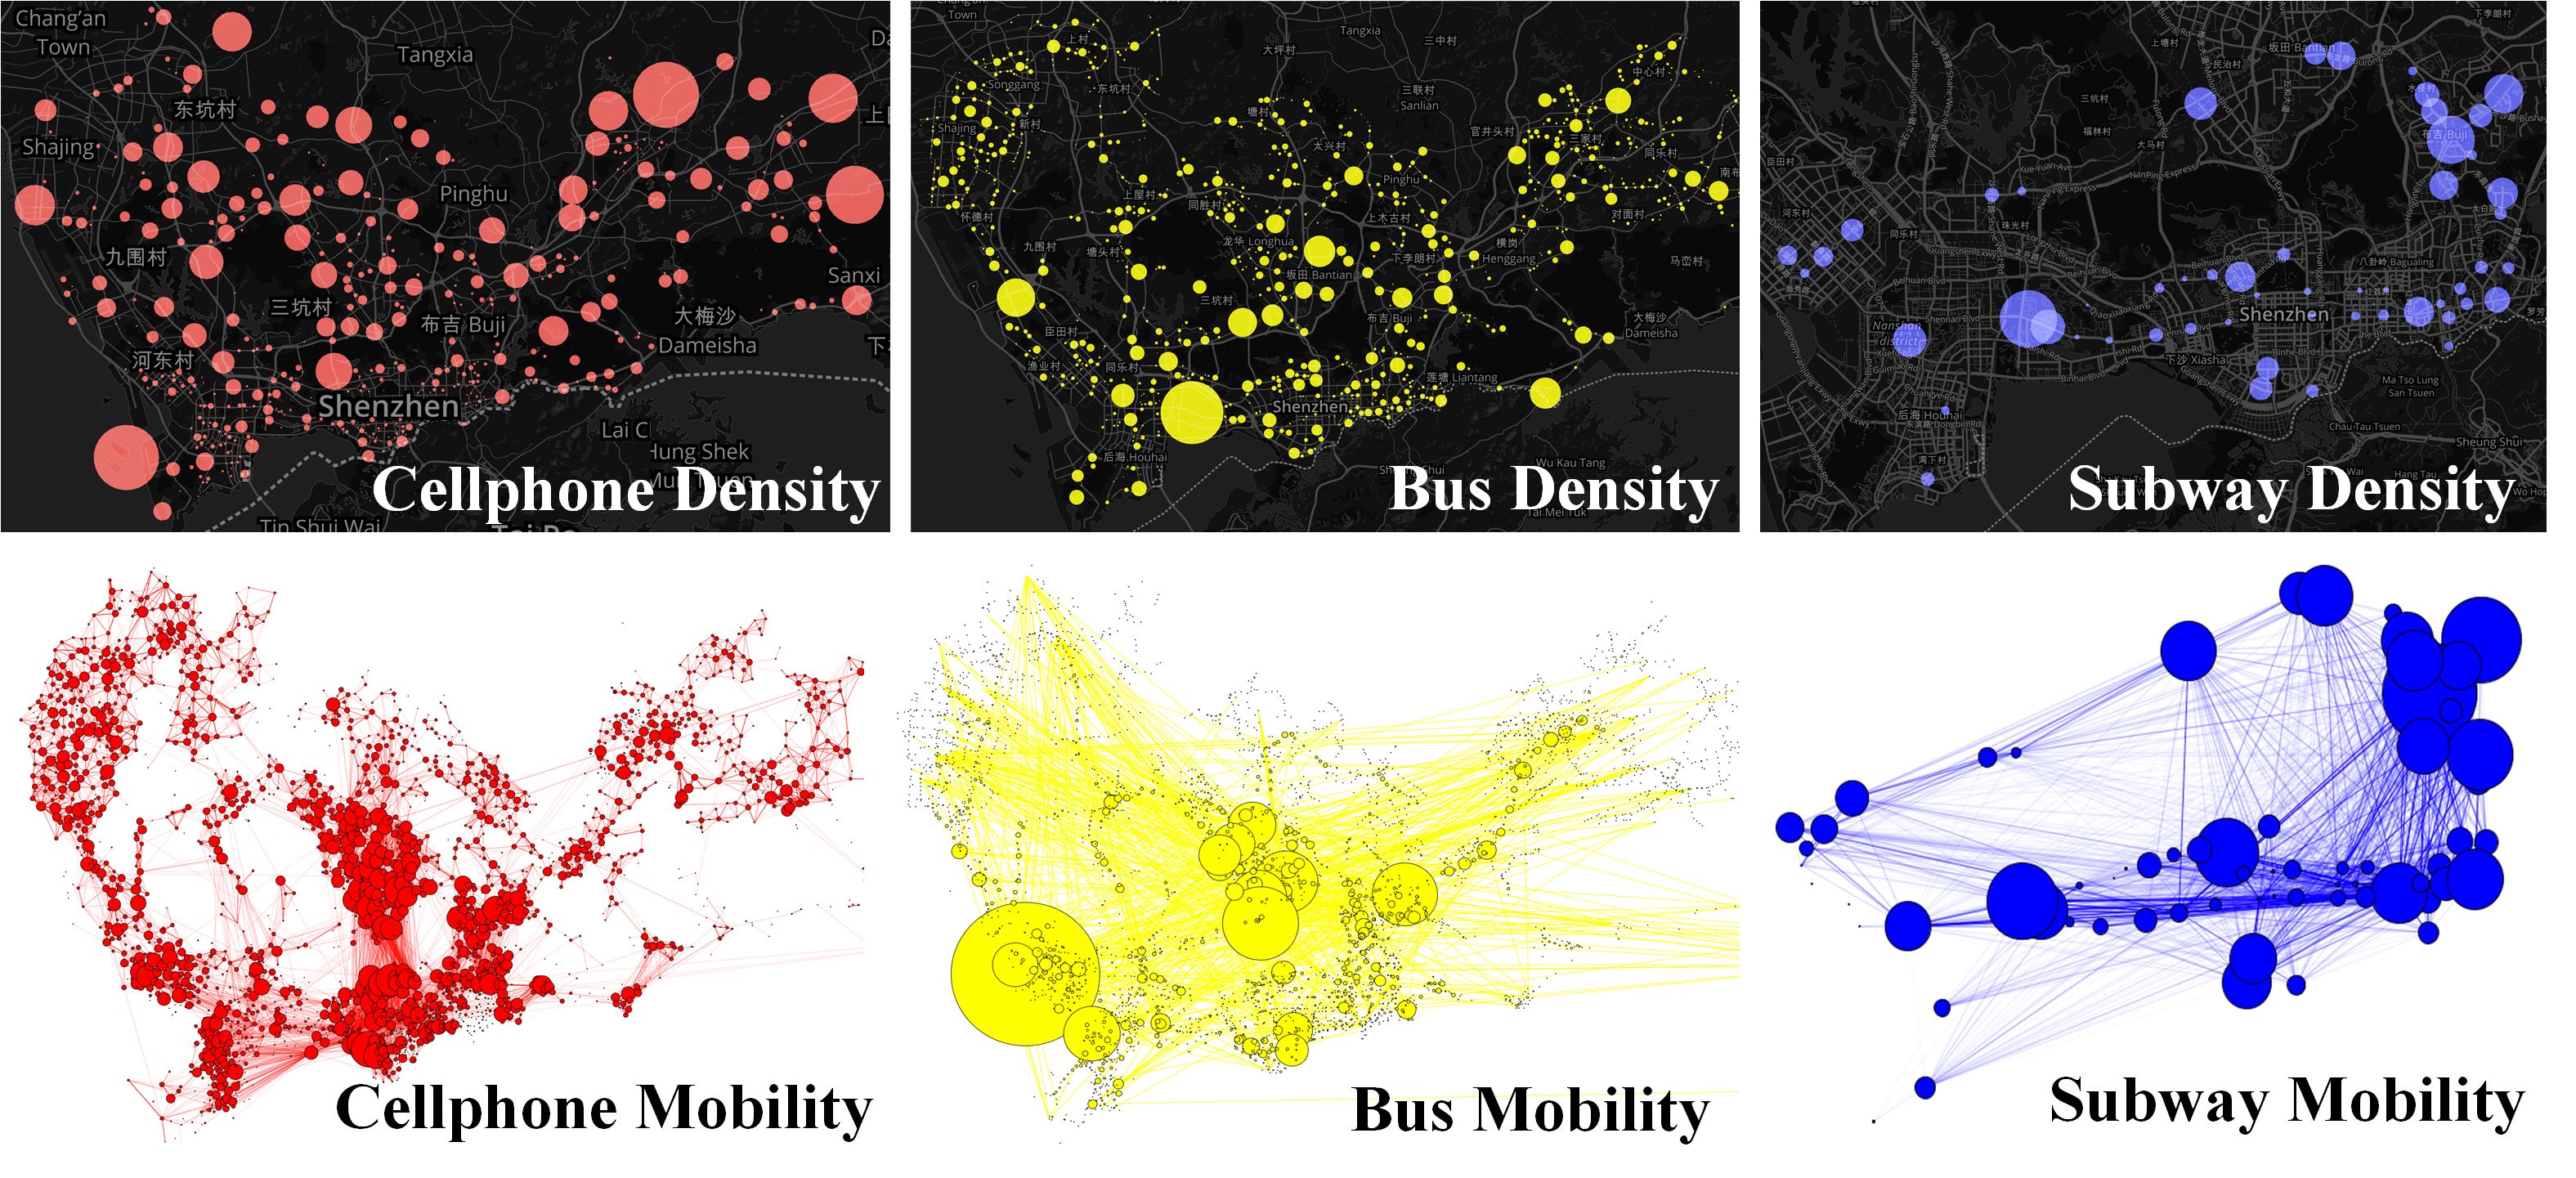
Heterogeneous SystemsWe study several heterogeneous systems in the same cities for their diversity. As shown by the figures above, for Beijing, we investigate three systems where private vehicles (blue) mostly travel nearby drivers' workplaces and homes; trucks (green) are mainly focused on highways; taxis (red) are evenly distributed across the cities; for Shenzhen, we investigate three taxi systems, where urban taxis (red) are focused around downtown; suburban taxis (green) are focused around uptown; electric taxis (blue) are cruising near charging stations. As shown by the figures below, we also study 4 highly-heterogeneous urban systems, i.e., cellphone systems at cell tower levels, taxi systems at GPS point levels, subway and bus systems at transit station levels; where the lighter the icon, the higher the resident density. Further, we investigate relationships between density and mobility among several urban systems. Based on these heterogeneous systems, we capture urban dynamics from complementary perspectives, e.g., the right figure gives visualization of real-time traffic speeds in Shenzhen based on these systems where the lighter the segment, the lower the speed, the higher the gas consumption. |
|
|
|
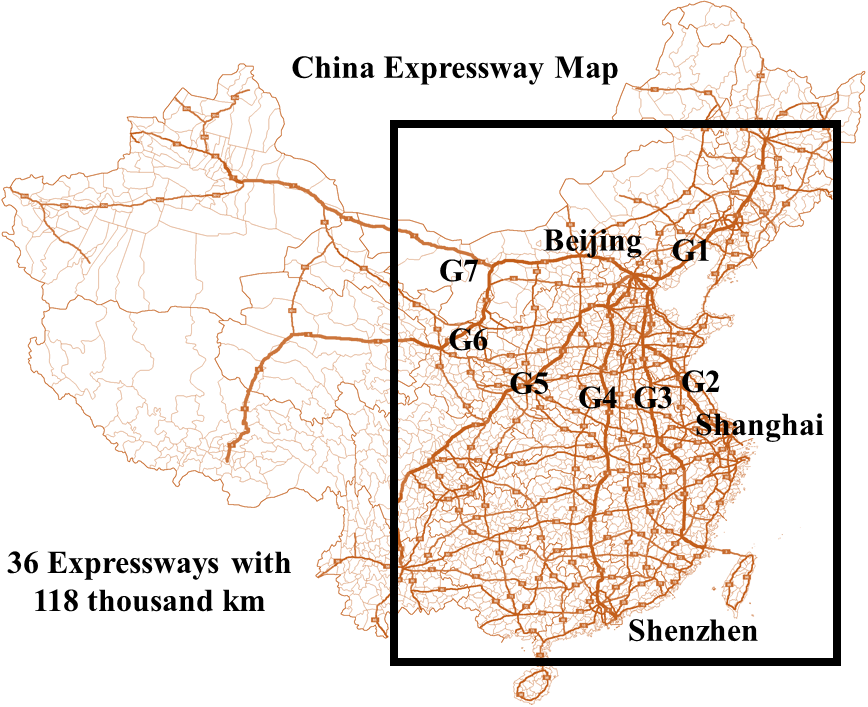
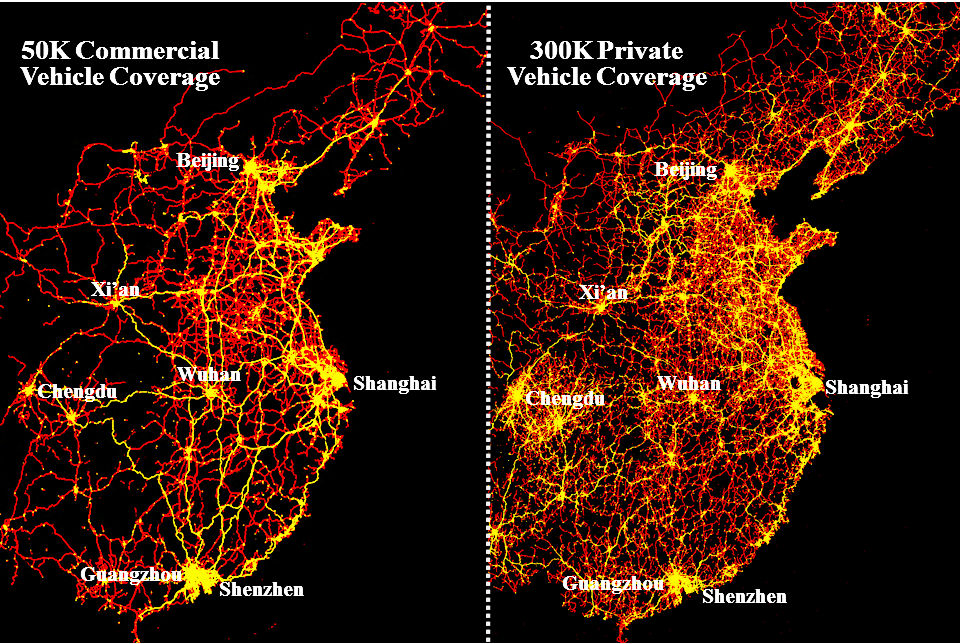
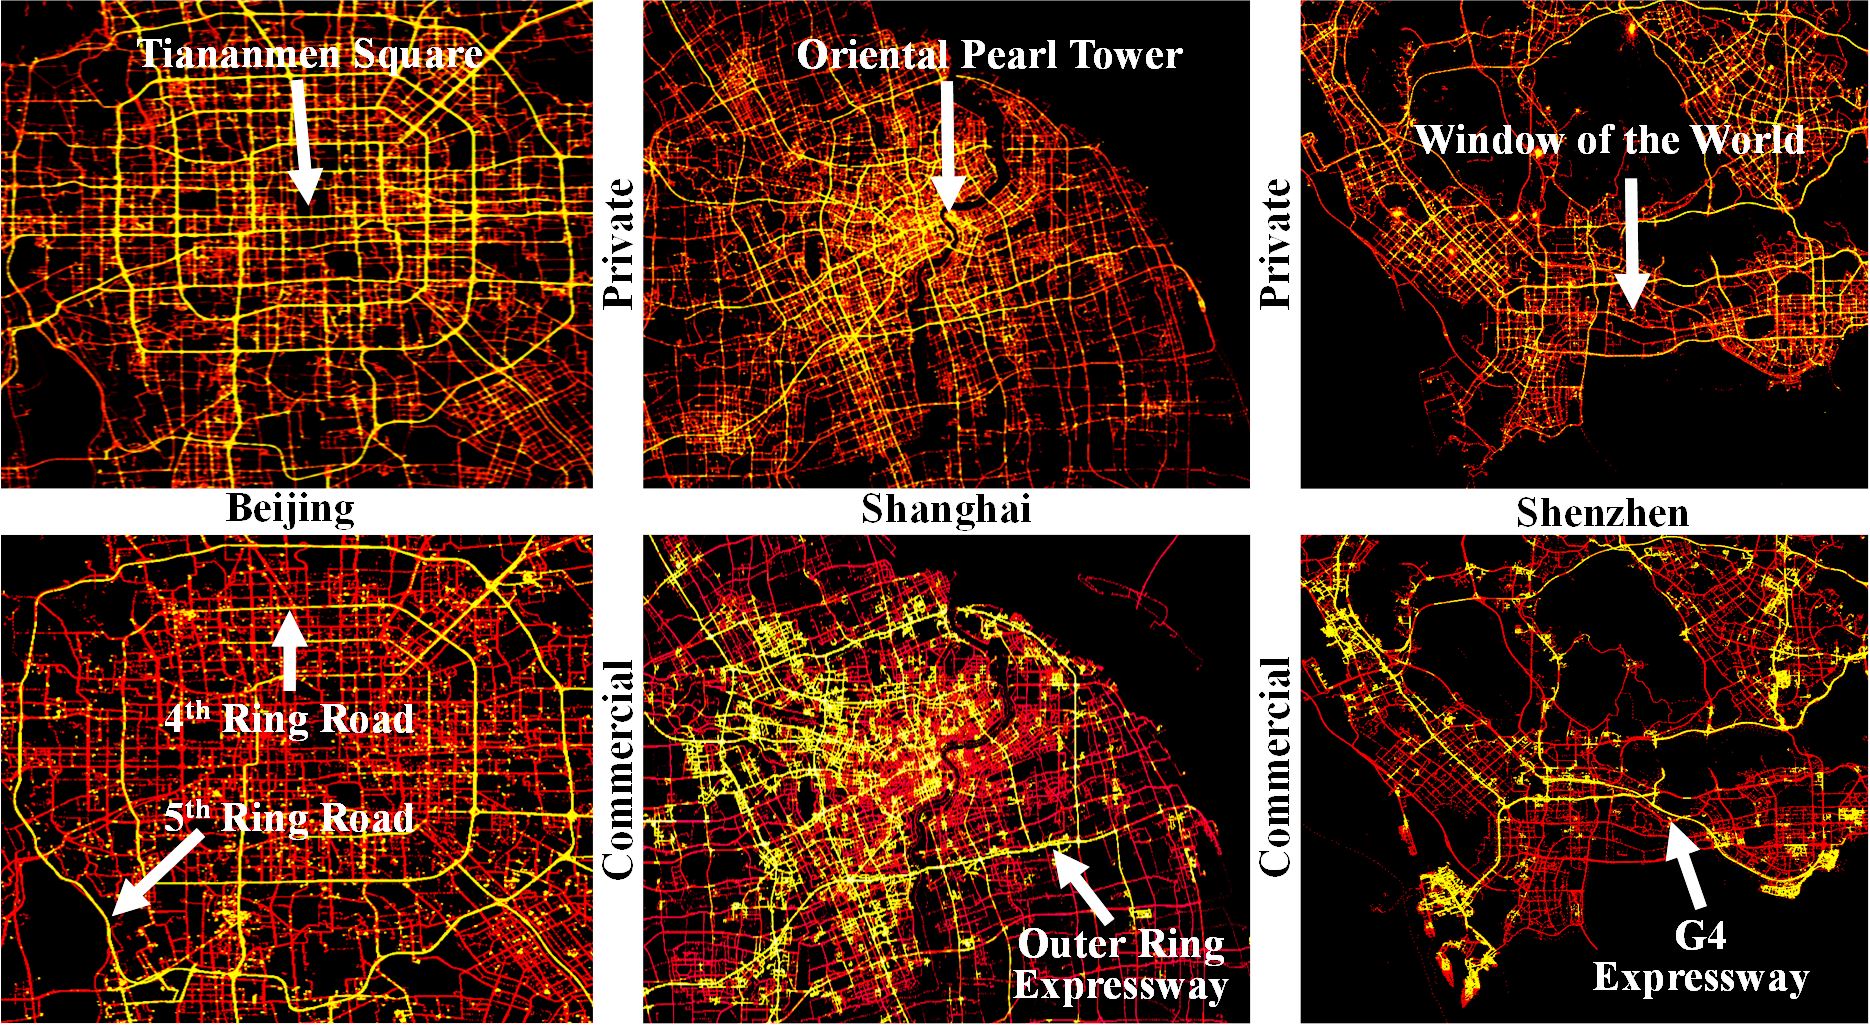
National Heterogeneous SystemsIn addition to urban scale, we have also been working on several systems at national scale based on their real-time GPS data, e.g., a commercial vehicle system with 50 thousand vehicles, and a private vehicle system with 300 thousand vehicles. The figure on the left is a China expressway map with 36 expressways, which connect major cities in China. The figure on the top gives a visualization of their coverages at three cities where the lighter the area, the higher the vehicle density. We found that the commercial vehicles are mostly focused on major highways, and the private vehicles are more evenly distributed around landmarks in the cities. The figure on the bottom gives one-day coverages of these two systems at national scale, both of them covers major cities in China, along with major highways such as all 7 radial expressways coded from G1 to G7. Also, we found that the commercial vehicles travel mostly on expressways with long distances, but private vehicles travel mostly near cities with short distances. Thus, based on their distinct features, these two systems can detect national-scale traffic dynamics from complementary perspectives, which can be used for many real-time applications, e.g., ridesharing, dispatching, and navigation. |